A note from Bob Pike: Who said, “You can fool some of the people all of the time, and all of the people some of the time, but you cannot fool all of the people all of the time”? Was it: Bob Marley, Abraham Lincoln, P.T. Barnum -- or somebody else entirely? Read on and see if you can find the connection between this quote and this insightful article (the answer is at the end!)
People do NOT remember 10 percent of what they read, 20 percent of what they see, 30 percent of what they hear, and so on. That information, and similar pronouncements, are fraudulent. Moreover, general statements on the effectiveness of learning methods are not credible—learning results depend on too many variables to enable such precision.
Unfortunately, this bogus information has been floating around our field for decades, crafted by many different authors and presented in many different configurations, including bastardizations of Dale's Cone.
My Search For Knowledge
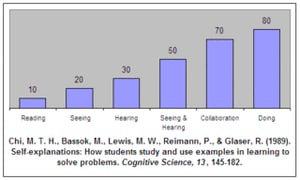
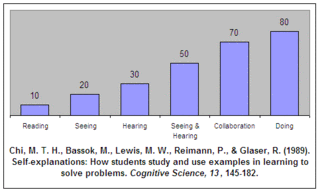
My investigation of this issue began when I came across the following graph:

After reading the cited article several times and not seeing the graph—nor the numbers on the graph—I got suspicious and got in touch with the first author of the cited study, Dr. Michelene Chi of the University of Pittsburgh (who is, by the way, one of the world's leading authorities on expertise). She said this about the graph: "I don't recognize this graph at all. So the citation is definitely wrong since it's not my graph."
What makes this particularly disturbing is that this graph has popped up all over our industry, and many instructional-design decisions have been based on the information contained in the graph.
Bogus Information is Widespread
I often begin my workshops on instructional design and e-learning and my conference presentations with this graph as a warning and wake up call. Typically, over 90 percent of the audience raises their hands when I ask whether anyone has seen the numbers depicted in the graph. Later, I often hear audible gasps and nervous giggles as the information is debunked. Clearly, many experienced professionals in our field know this graph and have used it to guide their decision making.
The graph is representative of a larger problem. The numbers presented on the graph have been circulating in our industry since the late 1960s, and they have no research backing whatsoever. Dr. JC Kinnamon (2002) of Midi, Inc., searched the web and found dozens of references to those dubious numbers in college courses, research reports, and in vendor and consultant promotional materials.
Where the Numbers Came From
The bogus percentages were first published by an employee of Mobil Oil Company in 1967, writing in the magazine Film and Audio-Visual Communications. D. G. Treichler didn’t cite any research, but our field has unfortunately accepted his/her percentages ever since. NTL Institute still claims that they did the research that derived the numbers. (See my response to NTL.)
Michael Molenda, a professor at Indiana University, is currently working to track down the origination of the bogus numbers. His efforts have uncovered some evidence that the numbers may have been developed as early as the 1940s by Paul John Phillips who worked at University of Texas at Austin and who developed training classes for the petroleum industry. During World War Two, Phillips taught Visual Aids at the U. S. Army's Ordnance School at the Aberdeen (Maryland) Proving Grounds, where the numbers have also appeared and where they may have been developed. Strange coincidence: I was born on these very same Aberdeen Proving Grounds.
Ernie Rothkopf, professor emeritus of Columbia University, one of the world's leading applied research psychologists on learning, reported to me that the bogus percentages have been widely discredited, yet they keep rearing their ugly head in one form or another every few years.
Many people now associate the bogus percentages with Dale’s “Cone of Experience,” developed in 1946 by Edgar Dale. It provided an intuitive model of the concreteness of various audio-visual media. Dale included no numbers in his model, and there was no research used to generate it. In fact, Dale warned his readers not to take the model too literally. Dale’s Cone, copied without changes from the third and final edition of his book, is presented below:
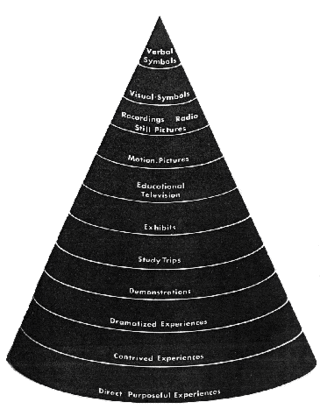
Dale’s Cone of Experience (Dale, 1969, p. 107)
You can see that Dale used no numbers with his cone. Somewhere along the way, someone unnaturally fused Dale’s Cone and Treichler’s dubious percentages. One common example is represented below.
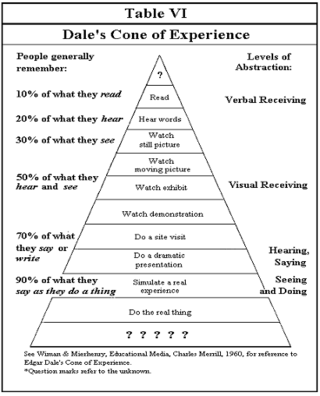
The source cited in the diagram above by Wiman and Meierhenry (1969) is a book of edited chapters. Though two of the chapters (Harrison, 1969; Stewart, 1969) mention Dale’s Cone of Experience, neither of them includes the percentages. In other words, the diagram above is citing a book that does not include the diagram and does not include the percentages indicated in the diagram.
The “Evidence” Changes to Meet the Need of the Deceiver
The percentages, and the graph in particular, have been passed around in our field from reputable person to reputable person. The people who originally created the fabrications are to blame for getting this started, but there are clearly many people willing to bend the information to their own devices. Kinnamon’s (2002) investigation found that Treichler’s percentages have been modified in many ways, depending on the message the shyster wants to send. Some people have changed the relative percentages. Some have improved Treichler’s grammar. Some have added categories to make their point. For example, one version of these numbers says that people remember 95 percent of the information they teach to others.
People have not only cited Treichler, Chi, Wiman and Meierhenry for the percentages, but have also incorrectly cited William Glasser, and correctly cited a number of other people who have utilized Treichler’s numbers.
It seems clear from some of the fraudulent citations that deception was intended. On the graph that prompted our investigation, the title of the article had been modified from the original to get rid of the word “students.” The creator of the graph must have known that the term “students” would make people in the training/development/performance field suspicious that the research was done on children. The creator of the Wiman and Meierhenry diagram did four things that make it difficult to track down the original source: (1) the book they cited is fairly obscure, (2) one of the author’s names is spelled wrong, (3) the year of publication is incorrect, (4) and the name Charles Merrill, which was actually a publishing house, was ambiguously presented so that it might have referred to an author or editor.
But Don’t The Numbers Speak The Truth?
The numbers are not credible, and even if they made sense, they'd still be dangerous.
If we look at the numbers a little more closely, they are highly unconvincing. How did someone compare “reading” and “seeing”? Don't you have to “see” to “read?” What does “collaboration” mean anyway? Were two people talking about the information they were learning? If so, weren't they “hearing” what the other person had to say? What does “doing” mean? How much were they “doing” it? Were they “doing” it correctly, or did they get feedback? If they were getting feedback, how do we know the learning didn’t come from the feedback—not the “doing”? Do we really believe that people learn more “hearing” a lecture, than “reading” the same material? Don’t people who “read” have an advantage in being able to pace themselves and revisit material they don’t understand? And how did the research produce numbers that are all factors of ten? Doesn’t this suggest some sort of review of the literature? If so, shouldn’t we know how the research review was conducted? Shouldn’t we get a clear and traceable citation for such a review?
Even the idea that you can compare these types of learning methods is ridiculous. As any good research psychologist knows, the measurement situation affects the learning outcome. If we have a person learn foreign-language vocabulary by listening to an audiotape and vocalizing their responses, it doesn’t make sense to test them by having them write down their answers. We’d have a poor measure of their ability to verbalize vocabulary. The opposite is also nonsensical. People who learn vocabulary by seeing it on the written page cannot be fairly evaluated by asking them to say the words aloud. It’s not fair to compare these different methods by using the same test, because the choice of test will bias the outcome toward the learning situation that is most like the test situation.
But why not compare one type of test to another—for example, if we want to compare vocabulary learning through hearing and seeing, why don't we use an oral test and written one? This doesn’t help either. It’s really impossible to compare two things on different indices. Can you imagine comparing the best boxer with the best golfer by having the boxer punch a heavy bag and having the golfer hit for distance? Would Muhammad Ali punching with 600 pounds of pressure beat Tiger Woods hitting his drives 320 yards off the tee?
The Importance of Listing Citations
Even if the numbers presented on the graph had been published in a refereed journal—research we were reasonably sure we could trust—it would still be dangerous not to know where they came from. Research conclusions have a way of morphing over time. Wasn’t it true 10 years ago that all fat was bad? Newer research has revealed that monounsaturated oils like olive oil might actually be good for us. If a person doesn’t cite their sources, we might not realize that their conclusions are outdated or simply based on poor research. Conversely, we may also lose access to good sources of information. Suppose Teichler had really discovered a valid source of information? Because he/she did not use citations, that research would remain forever hidden in obscurity.
The context of research makes a great deal of difference. If we don’t know a source, we don’t really know whether the research is relevant to our situation. For example, an article by Kulik and Kulik (1988) concluded that immediate feedback was better than delayed feedback. Most people in the field now accept their conclusions. Efforts by Work-Learning Research to examine Kulik and Kulik’s sources indicated that most of the articles they reviewed tested the learners within a few minutes after the learning event, a very unrealistic analog for most training situations. Their sources enabled us to examine their evidence and find it faulty.
Who Should We Blame?
The original shysters are not the only ones to blame. The fact that many people who have disseminated the graph used the same incorrect citation makes it clear that they never accessed the original study. Everyone who uses a citation to make a point (or draw a conclusion) ought to check the citation. That, of course, includes all of us who are consumers of this information.
What Does This Tell Us About Our Field?
It tells us that we may not be able to trust the information that floats around our industry. It tells us that even our most reputable people and organizations may require the Wizard-of-Oz treatment—we may need to look behind the curtain to verify their claims.
The Danger To Our Field
At Work-Learning Research, our goal is to provide research-based information that practitioners can trust. We began our research efforts several years ago when we noticed that the field jumps from one fad to another while at the same time holding religiously to ideas that would be better cast aside.
The fact that our field is so easily swayed by the mildest whiffs of evidence suggests that we don’t have sufficient mechanisms in place to improve what we do. Because we’re not able or willing to provide due diligence on evidence-based claims, we’re unable to create feedback loops to push the field more forcefully toward continuing improvement.
Isn’t it ironic? We’re supposed to be the learning experts, but because we too easily take things for granted, we find ourselves skipping down all manner of yellow-brick roads.
How to Improve the Situation
It will seem obvious, but each and every one of us must take responsibility for the information we transmit to ensure its integrity. More importantly, we must be actively skeptical of the information we receive. We ought to check the facts, investigate the evidence, and evaluate the research. Finally, we must continue our personal search for knowledge—for it is only with knowledge that we can validly evaluate the claims that we encounter.
Conclusion from Bob Pike: The beginning quote is attributed to Abraham Lincoln – and almost everyone has been fooled by the “Cone” given above – including me. I've referred to it in my Creative Training Techniques Handbook (and it won't be in the next addition)!
Dr. Will Thalheimer is a learning expert, researcher, instructional designer, business leader, speaker, and writer. For over 10 years as President of Work-Learning Research, he’s been leading the learning-and-performance industry in providing practical research-based wisdom to help learning executives and professionals build wildly more effective training interventions and learning environments. You can access his free research-to-practice reports at the Work-Learning Research website catalog (www.work-learning.com) or view his industry-leading blog at (www.willatworklearning.com).
Our Citations
Chi, M. T. H., Bassok, M., Lewis, M. W., Reimann, P., & Glaser, R. (1989). Self-explanations: How students study and use examples in learning to solve problems. Cognitive Science, 13, 145-182.
Dale, E. (1946, 1954, 1969). Audio-visual methods in teaching. New York: Dryden.
Harrison, R. (1969). Communication theory. In R. V. Wiman and W. C. Meierhenry (Eds.) Educational media: Theory into practice. Columbus, OH: Merrill.
Kinnamon, J. C. (2002). Personal communication, October 25.
Kulik, J. A., & Kulik, C-L. C. (1988). Timing of feedback and verbal learning. Review of Educational Research, 58, 79-97.
Molenda, M. H. (2003). Personal communications, February and March.
Rothkopf, E. Z. (2002). Personal communication, September 26.
Stewart, D. K. (1969). A learning-systems concept as applied to courses in education and training. In R. V. Wiman and W. C. Meierhenry (Eds.) Educational media: Theory into practice. Columbus, OH: Merrill.
Treichler, D. G. (1967). Are you missing the boat in training aids? Film and Audio-Visual Communication, 1, 14-16, 28-30, 48.
Wiman, R. V. & Meierhenry, W. C. (Eds.). (1969). Educational media: Theory into practice. Columbus, OH: Merrill.
The full article can be found at http://www.willatworklearning.com/2006/05/people_remember.html