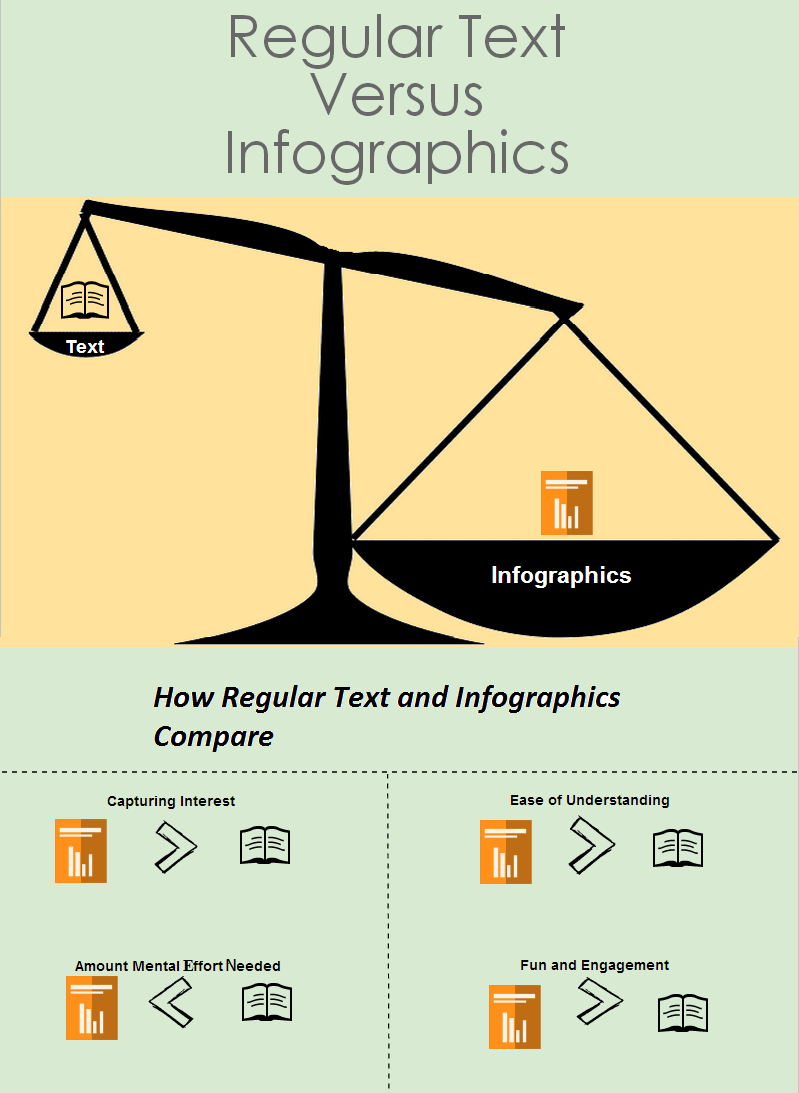
Pictures may say a thousand words, but it’s not always easy to hear what they’re saying. For example, the meaning of the small graphic to the left is probably unclear, but when words are added to the picture, you get the easily understood infographic, seen below.
For trainers and participants, infographics provide a happy marriage between visuals and words that increases learning. Here are just a few ways you can use infographics to improve your training:
Use as an Effective Opener
Effective openers must capture interest, facilitate networking and align with the content of your training session. An infographic easily meets these requirements. Oftentimes newspapers, advertisers and nonprofits capture interest by illustrating a startling statistic or point in a visual way. This is something that was done to great effect by the Enliven Project’s infographic detailing the small percentage of rapists jailed for their crimes. Infographics also capture interest and break preoccupation through the use of color and graphics.
Infographics help facilitate networking by introducing information quickly, as they're adept at outlining broad concepts in succinct and interesting ways. When using infographics, it’s not necessary to spend minutes outlining key concepts to prime your participants for a discussion. Instead, simply show an infographic illustrating your point. Then lead your participants into a discussion or activity relating to the concept outlined.
Over the past four years the use and creation of infographics has ballooned, making it easy to find one relevant to your content. A Google Search for the phrase “training and development infographic” yields hundreds of results. A number of organizations collect infographics on particular topics. The Bob Pike Group, for example, regularly pins infographics on training and development to their Pinterest page.
If, for some reason, you can’t find a relevant infographic, you can create one. A number of free websites offer premade templates to help you create your infographic, several of which are detailed in “10 Free Tools for Creating Infographics” by The Creative Blog. Though you may cringe at the work involved in this task, you shouldn’t. The infographic featured in this article only took twenty minutes to make, thanks to the help of Piktochart.
Improve Instructional Manuals
Instructional manuals are excellent resources. Participants can take them from the classroom to their jobs and consult them as needed. Unfortunately, the text of instructional manuals doesn’t yield as high of retention rates as training sessions. The reason for the relatively low rate of retention for reading, a mere 20%, is that words take more time and effort for our minds to interpret. Although visuals are easily interpreted by our brains, they don’t convey the perspective, detail and clarity that words do. Infographics effectively address the pitfalls of the two types of media by combining them, resulting in higher yields of retention.
Increase the Likelihood Your Material is Read
Lengthy clusters of text often result in unread handouts, manuals and other training materials. If the lengthy material is read at all, it is skimmed. Using infographics will reduce word count and increase the likelihood that your material is read.
If you’d like to learn more about how infographics will improve your training, check out Scott Enebo’s session, “Strike a Power Chord with Learners By Using Infographics,” which will take place at The Bob Pike Group’s 21st Annual Creative Training Techniques Conference.